QMX+ measurements: filter sweeps, output spectra and power
29/09/2026
Companion page to QRP Labs QMX+ build. It collects all the measurements I did on my QMX+ after the build, as a reference:
- Low-pass filter sweeps for every band
- RF input filter sweeps for every band
- Output spectrum on every band, measured with a spectrum analyzer
- Output power at maximum PA voltage
All measurements were taken after the PA modification (4+4 BS170, see the main post). I did not measure anything before the modification, so there is no before/after comparison.
How the filter sweeps were measured
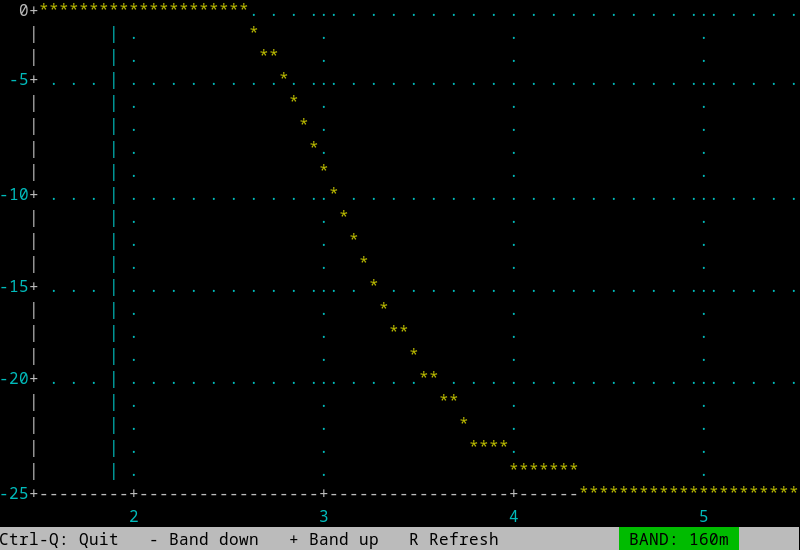
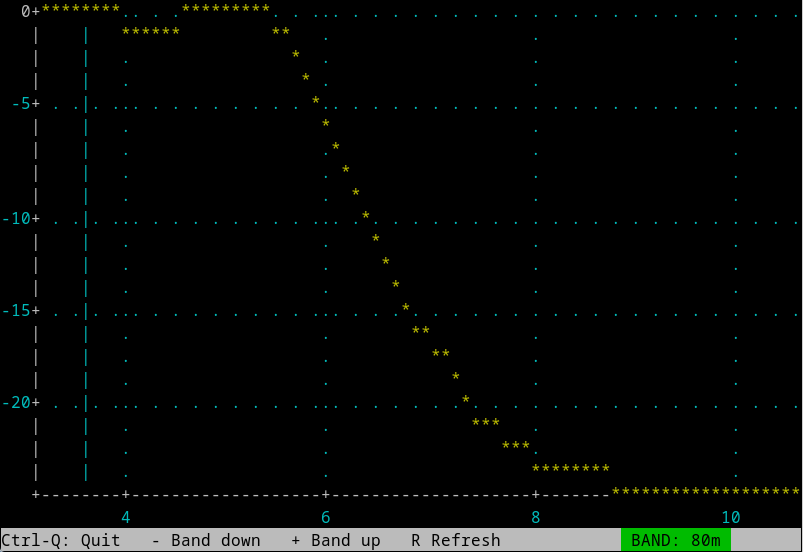
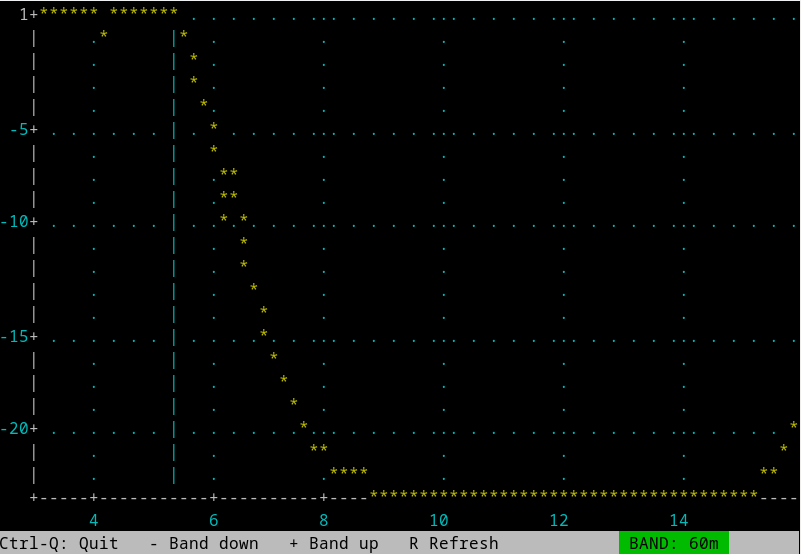
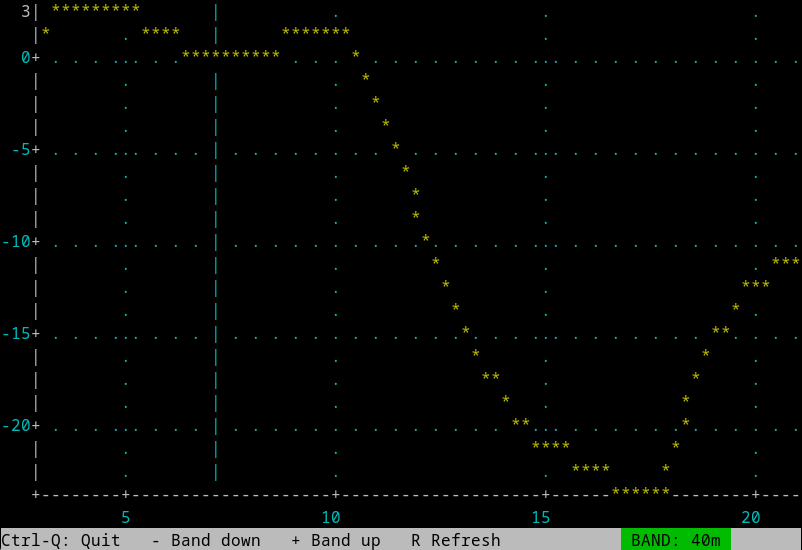
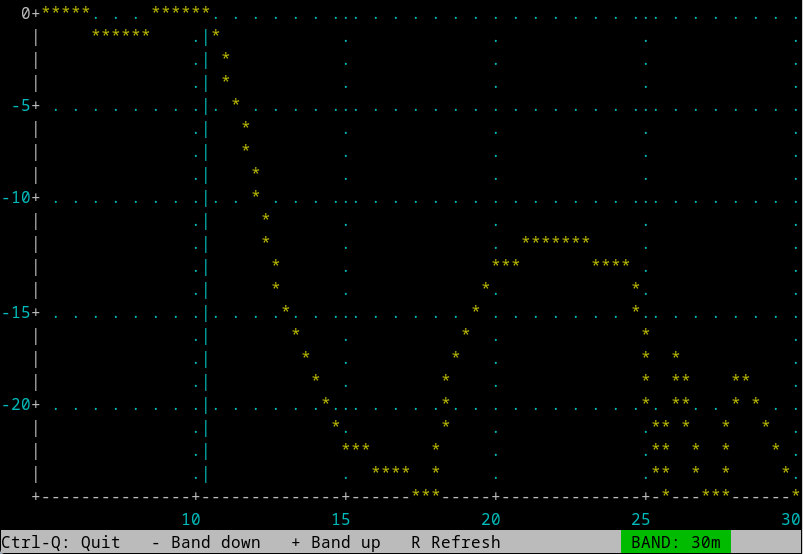
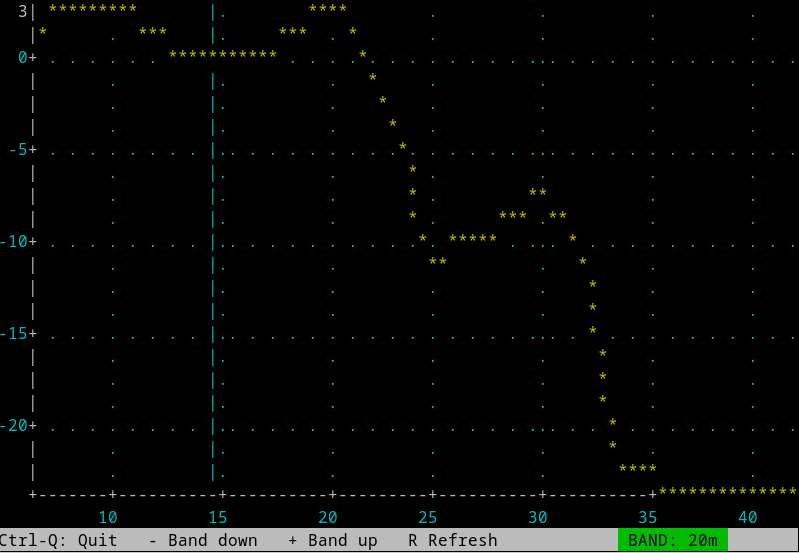
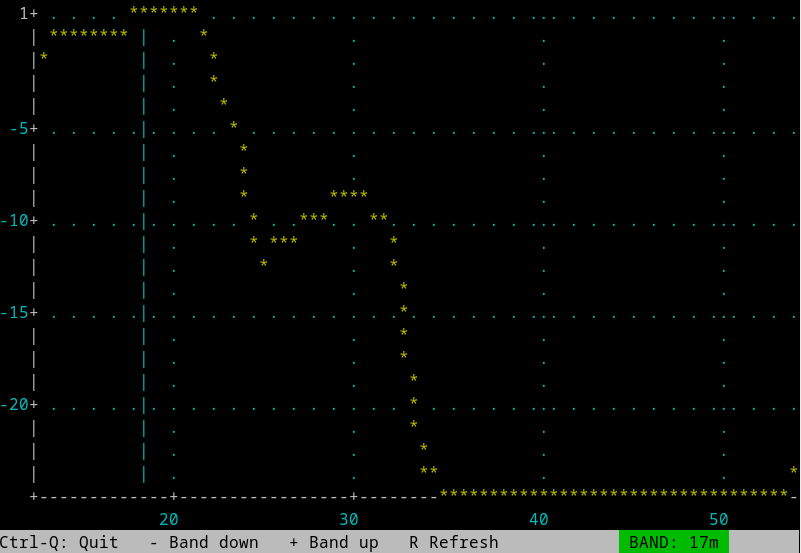
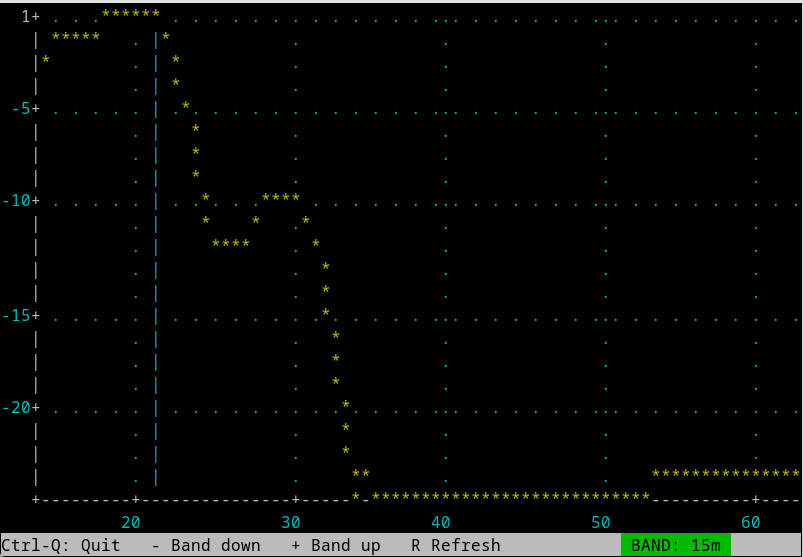
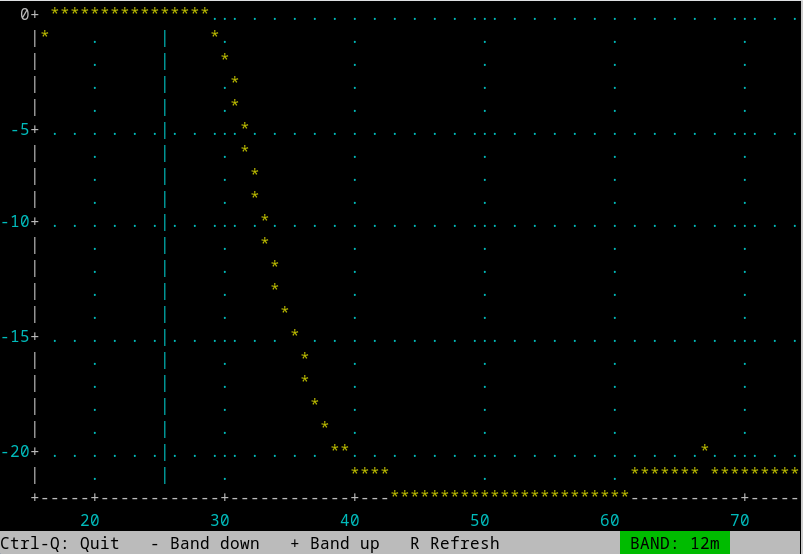
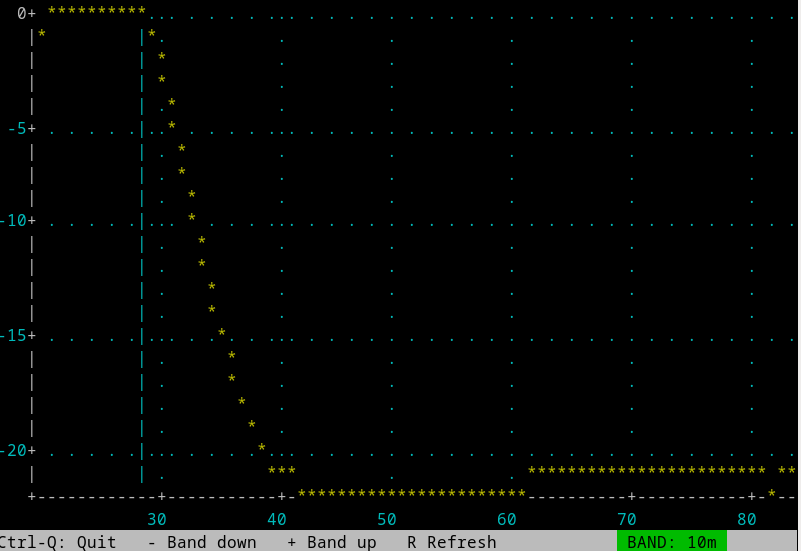
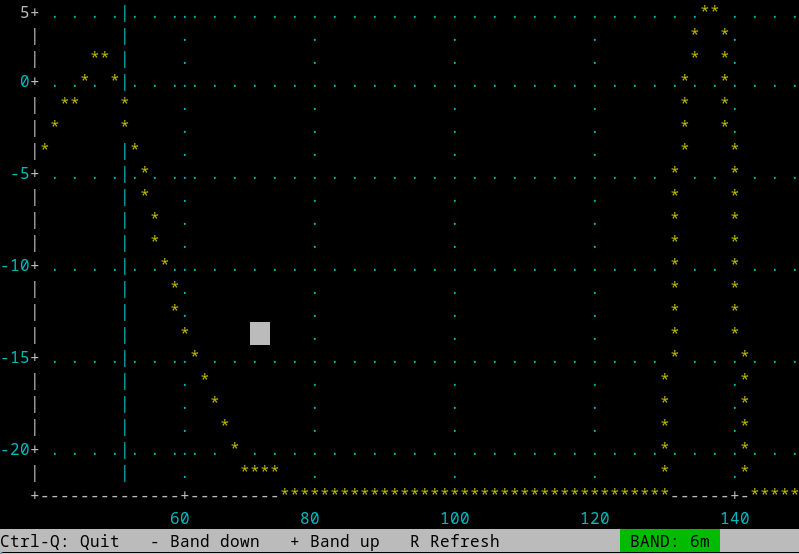
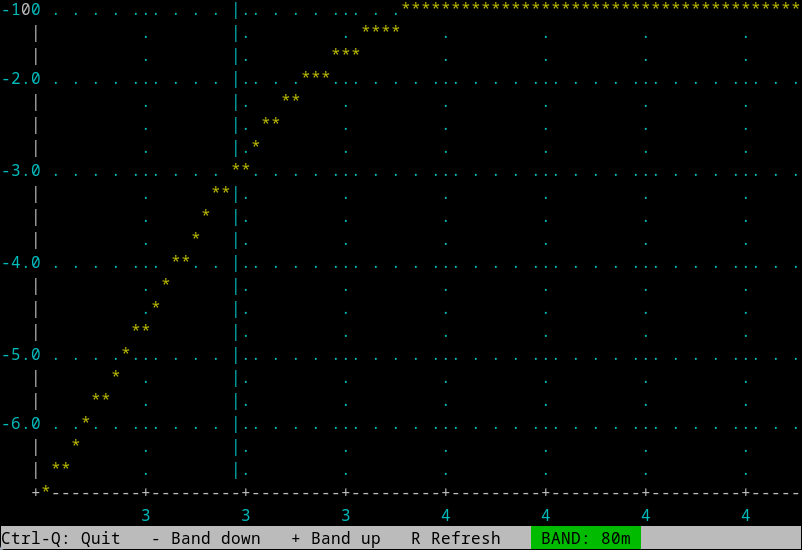
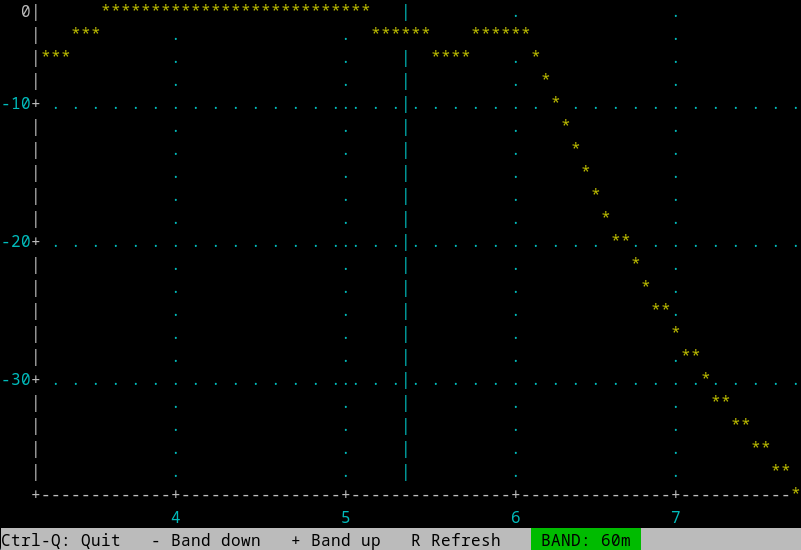
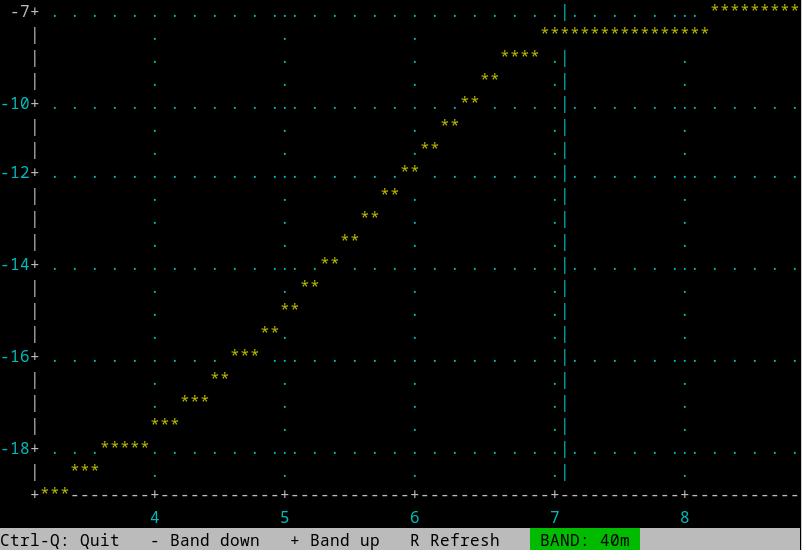
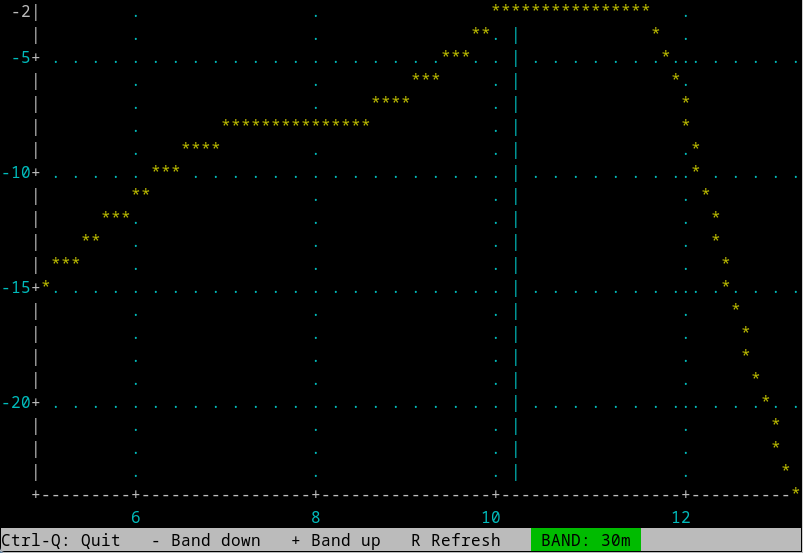
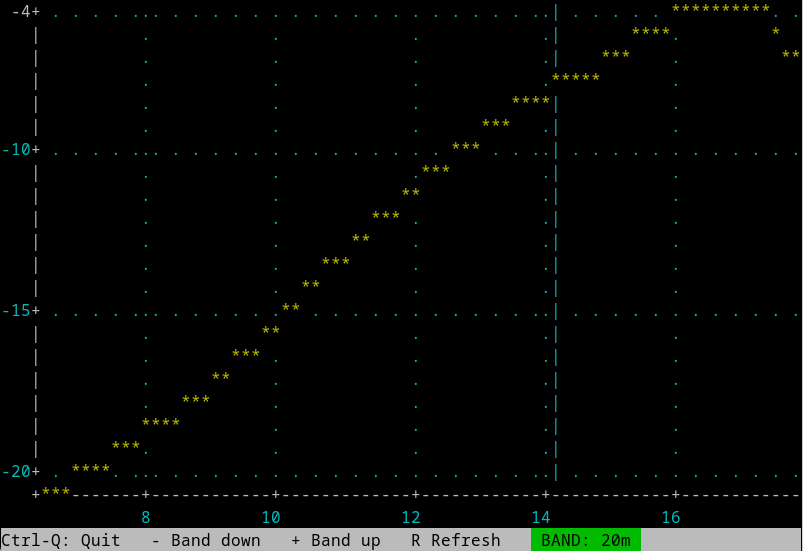
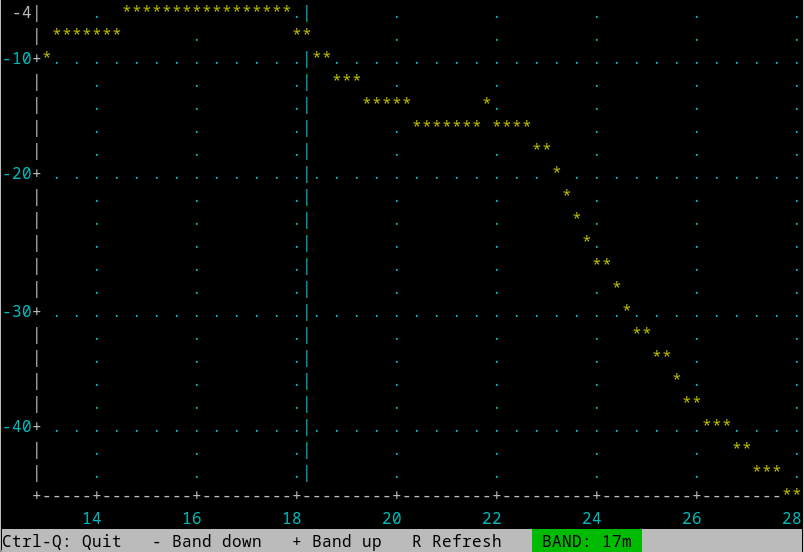
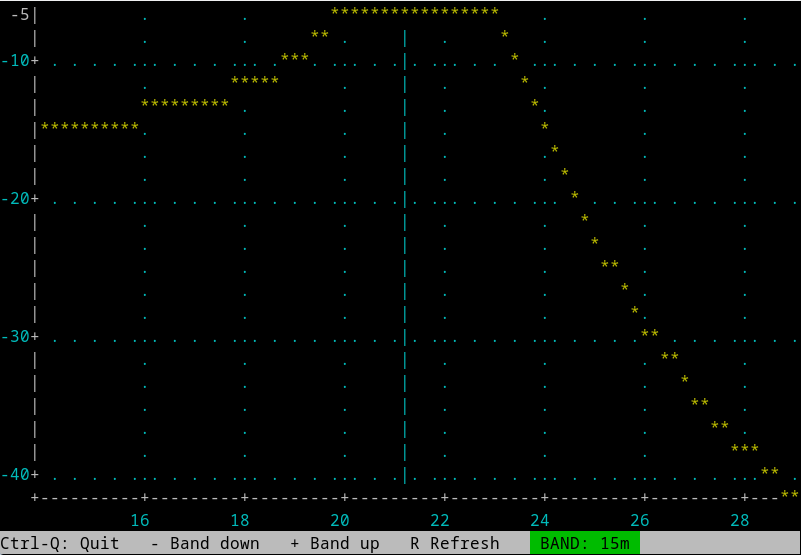
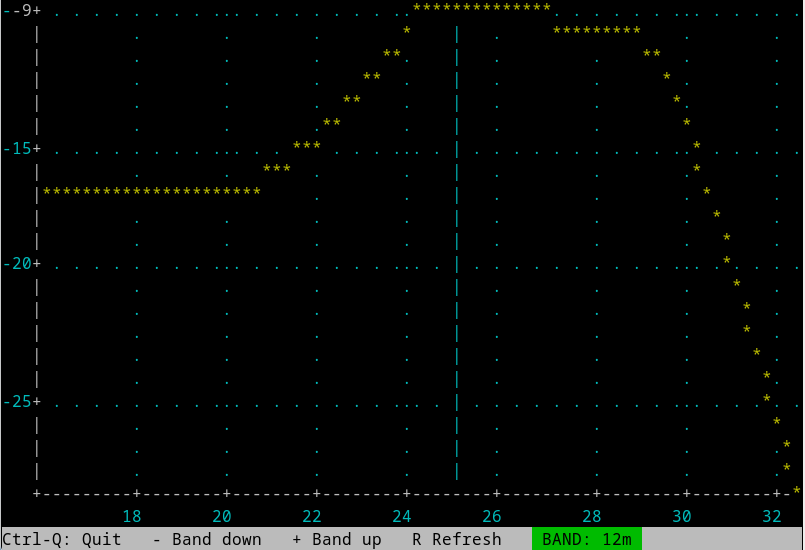
The QMX+ has a built-in filter measurement that can be run from the terminal over USB. The radio was connected to a dummy load. Each plot shows the response of the selected filter for that band: frequency in MHz on the horizontal axis, level in dB on the vertical axis, with the vertical line marking the amateur band.
Things to keep in mind when reading them:
- The plots are relative levels, not absolute power.
- The vertical axis is scaled per plot, so the absolute numbers should not be compared from one band to the next.
- For the low-pass filters, the measurement floor is roughly -22 to -25 dB, so these plots show the shape of the passband and the first part of the roll-off. They say nothing about harmonic suppression beyond that.
Low-pass filter sweeps
160m
80m
60m
40m
30m
20m
17m
15m
12m
10m
6m
Observations
- On all bands the passband is flat through the amateur band, followed by a roll-off to the measurement floor.
- On some bands (30m, 20m, 17m, 15m) the response rises again in the stopband to roughly -8 to -12 dB before falling to the floor. On 40m it rises again above about 16 MHz. On 6m there is a narrow peak around 135 MHz.
- Because of the limited dynamic range, I can't tell from these plots whether these features are real filter behaviour or an effect of the measurement itself.
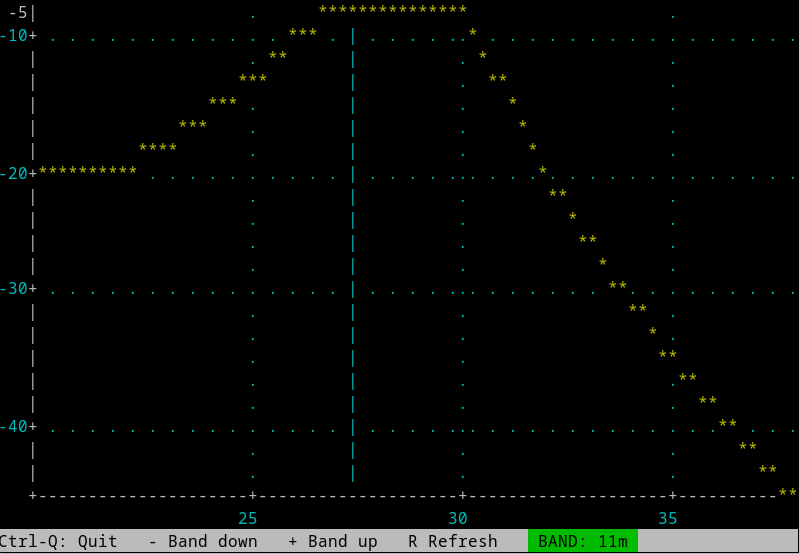
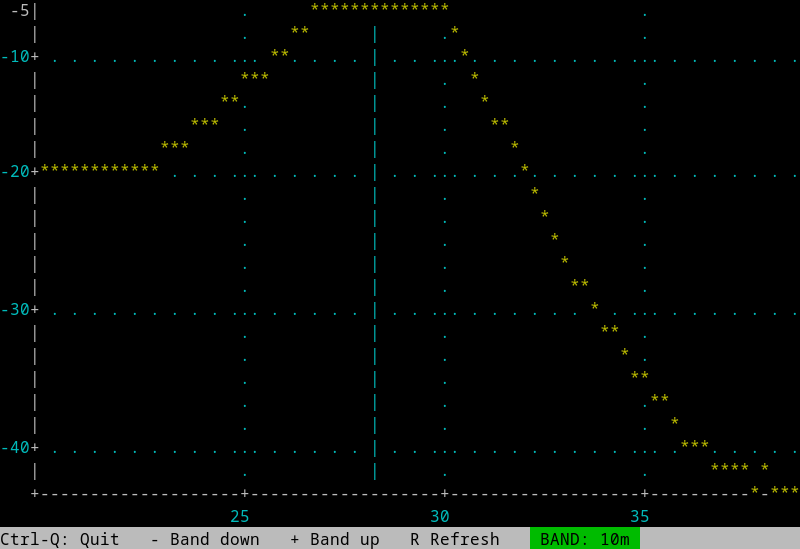
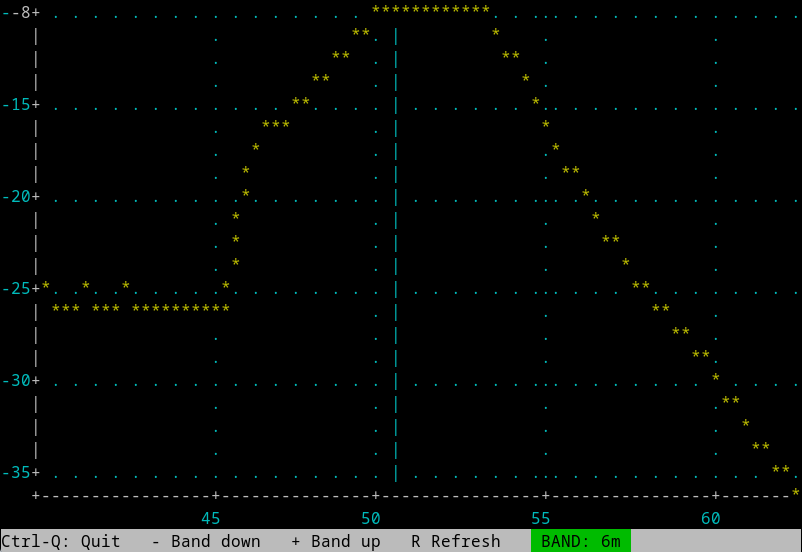
RF input filter sweeps
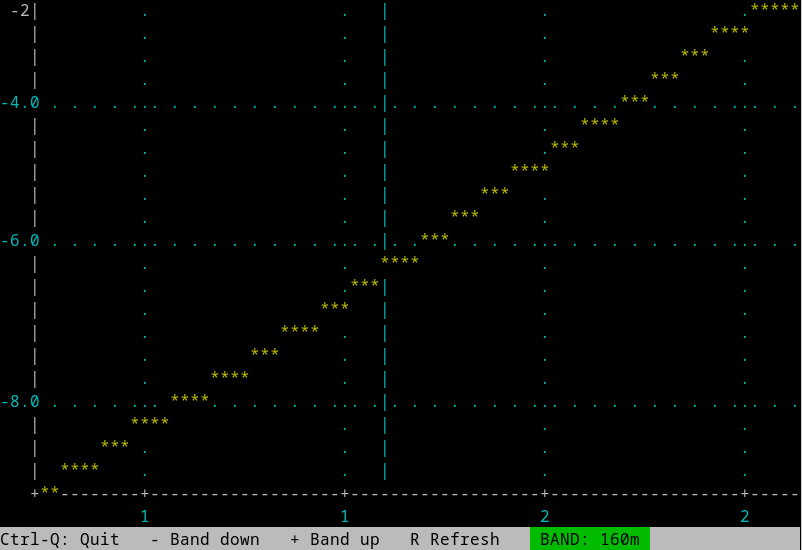
These plots show the response of the RF filter (input filter) for the selected band. On some bands (160m, 80m, 40m, 20m) the sweep window only shows part of the response. The RF input filter is not part of the PA, so the modification should not affect it.
160m
80m
60m
40m
30m
20m
17m
15m
12m
11m
10m
6m
Output spectrum (spurs)
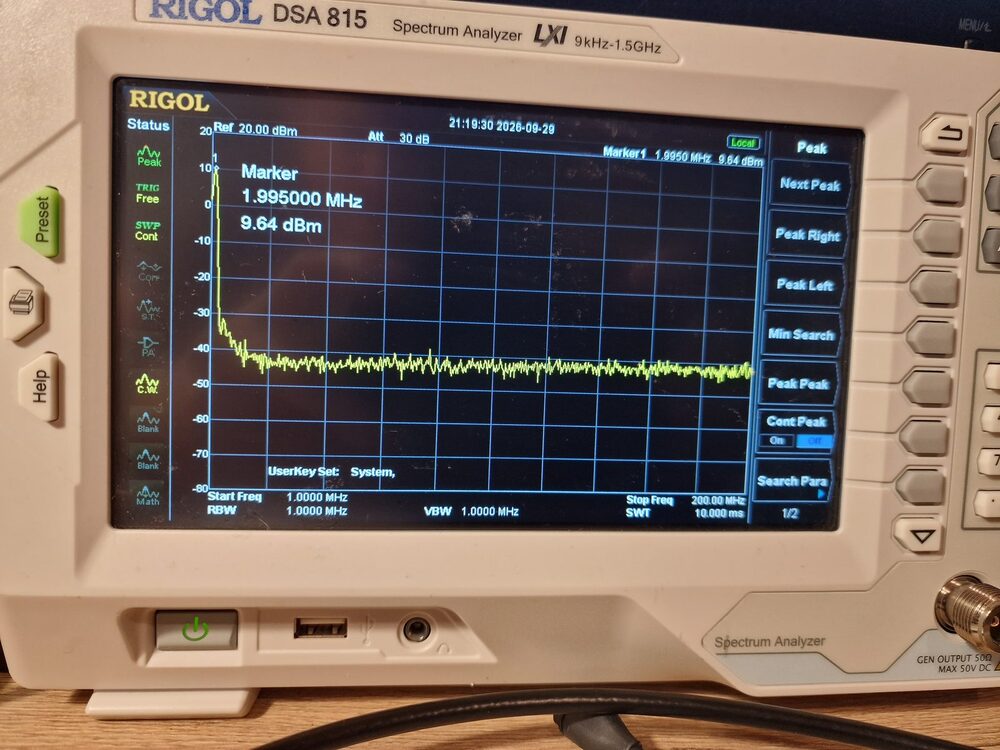
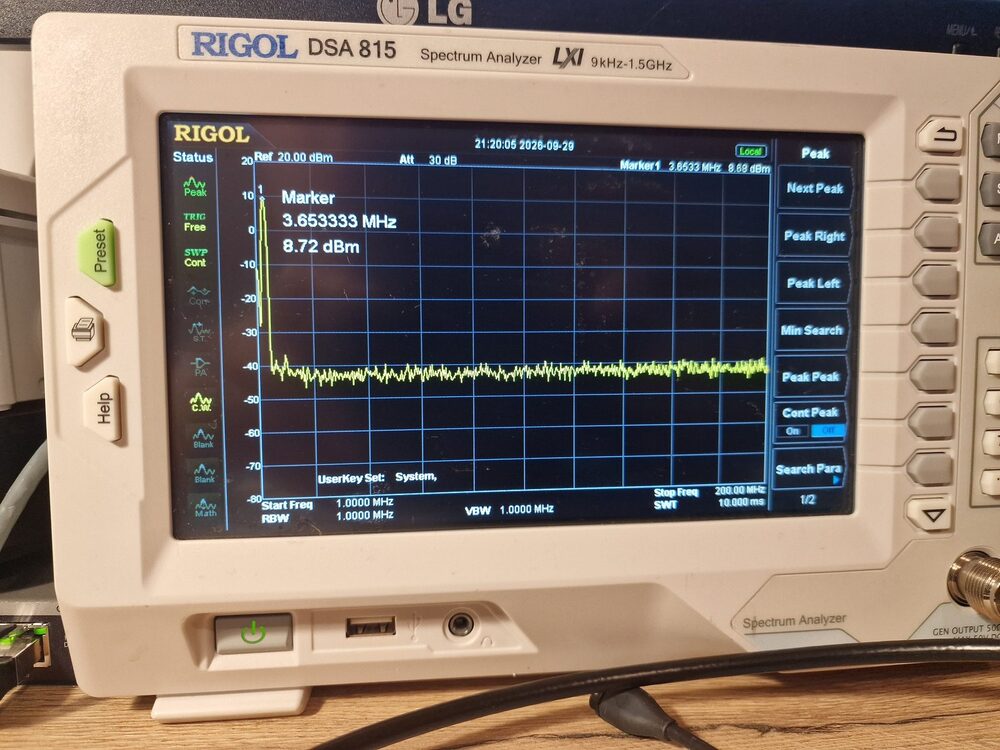
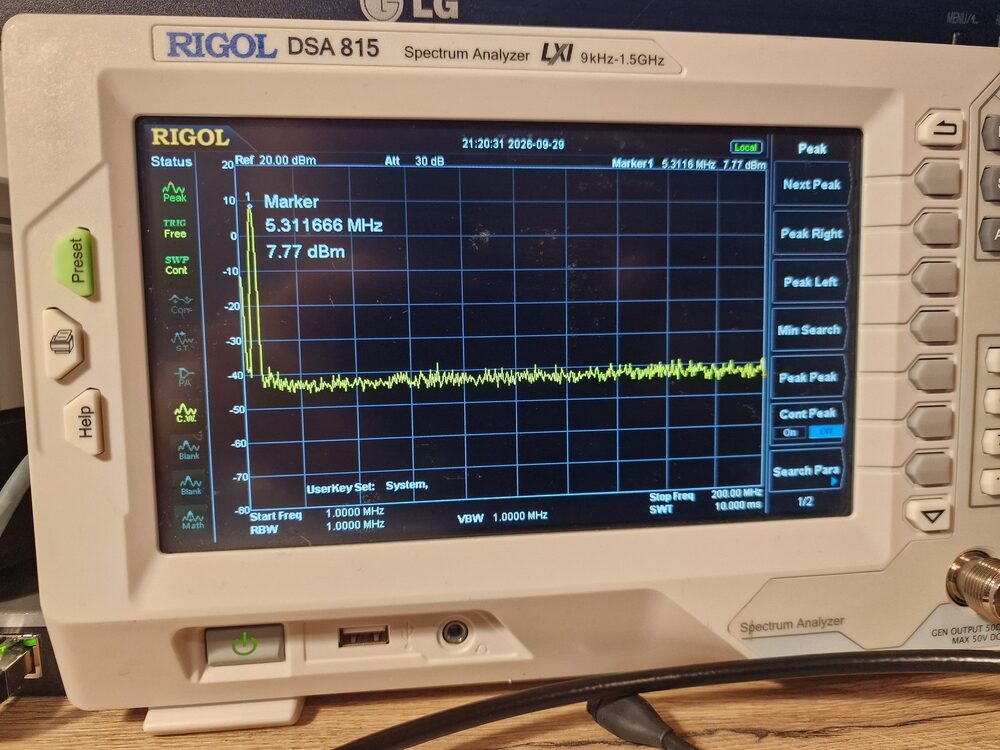
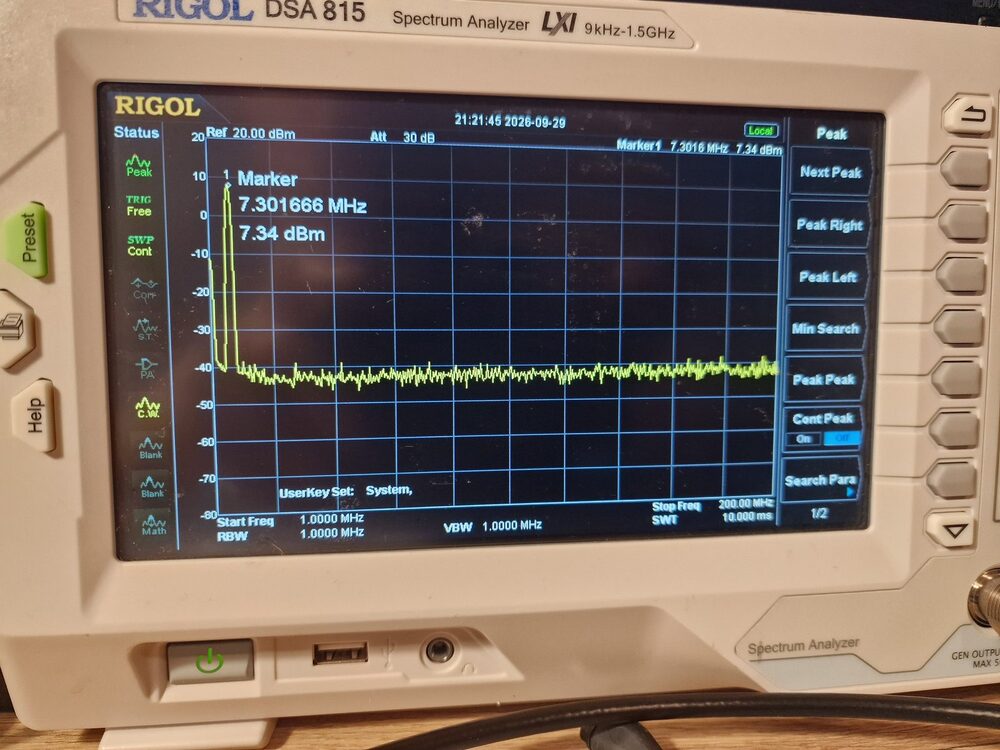
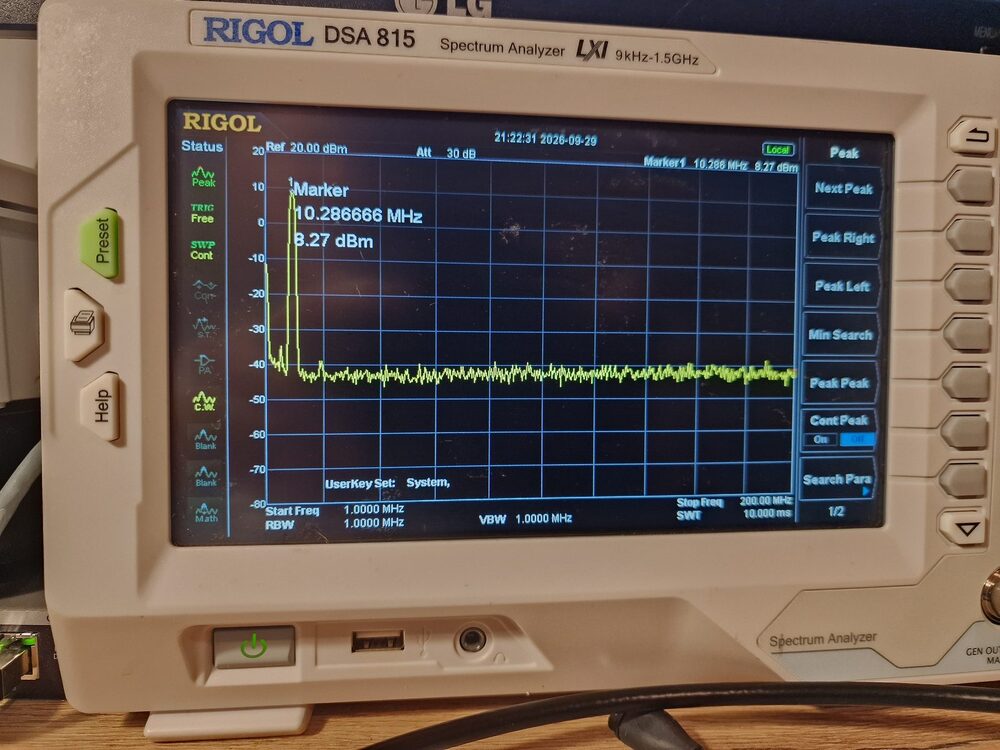
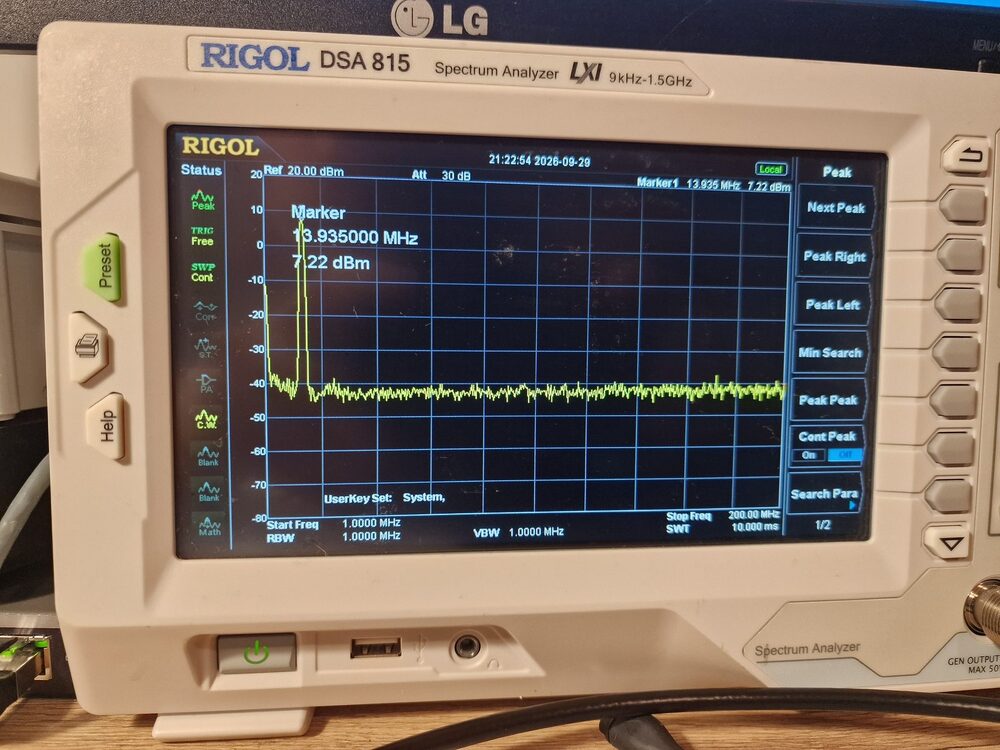
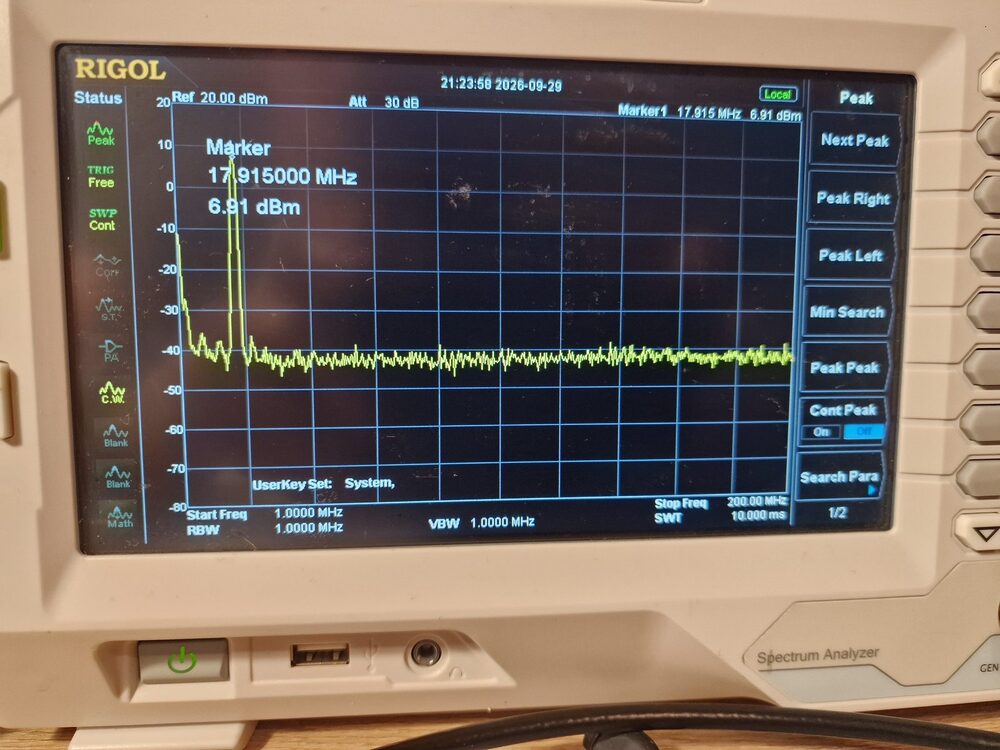
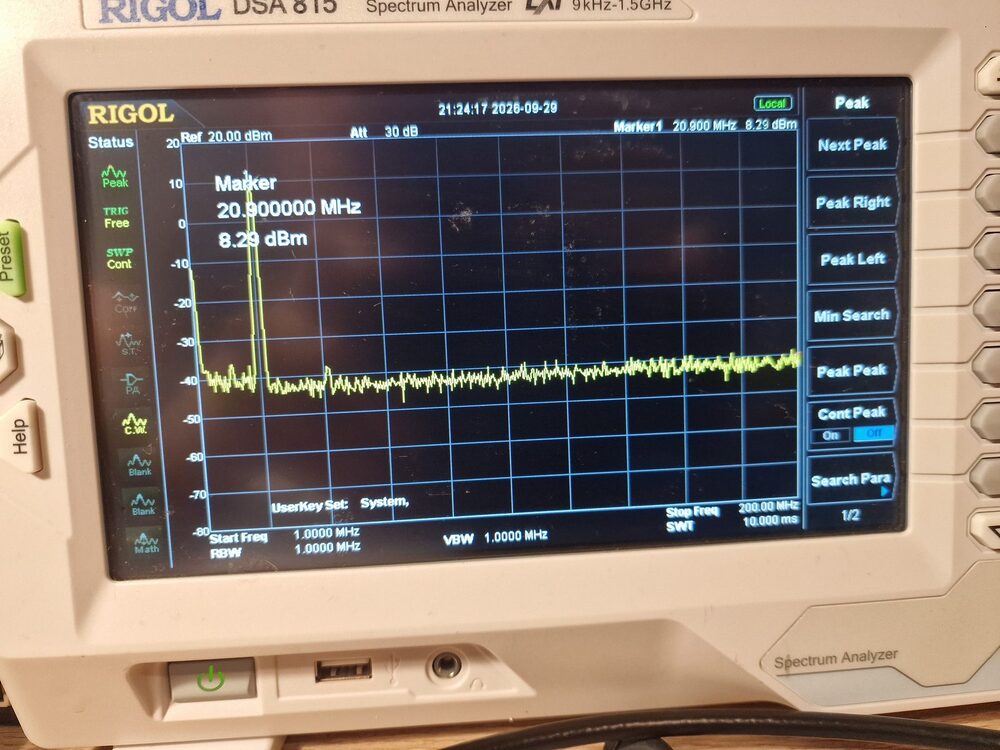
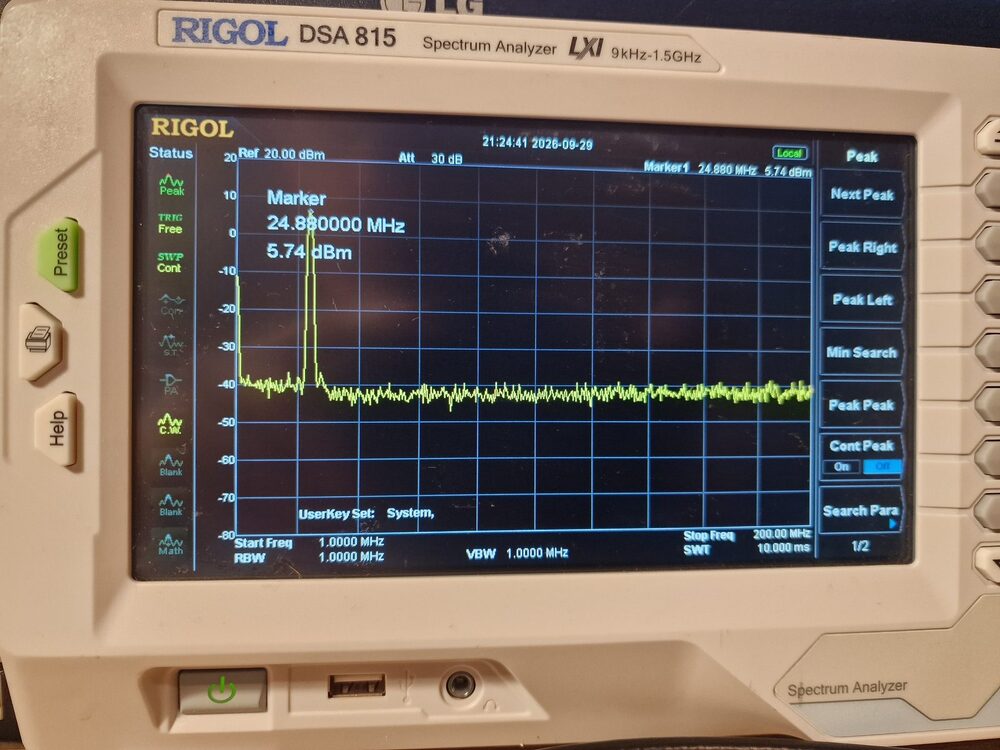
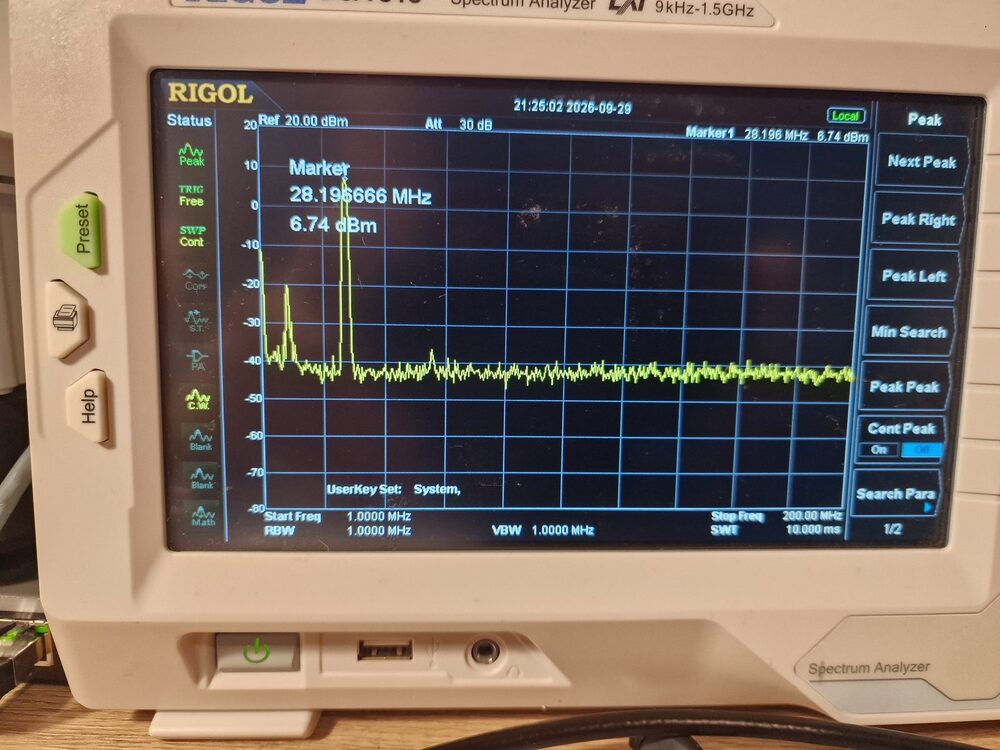
Output spectrum of the QMX+ on each band, measured with a Rigol DSA815 through a 30 dB attenuator. All of these are at the maximum PA voltage in the menu, with a 12.6 V supply, so they also show the maximum output power. The plots from 160m to 10m use a span of 1-200 MHz with a resolution bandwidth of 1 MHz; the 6m plot uses 30-200 MHz. The frequency in each marker is only the nearest sweep point, not the exact carrier frequency.
On 160m, 80m, 60m and 40m no spurs stand out above the noise floor (about -42 dBm) between 1 and 200 MHz. On 30m, 20m and 15m there is a very small bump at roughly twice the carrier frequency, at about -39 dBm, barely above the noise floor. Read from the plot, that is more than 45 dB below the fundamental. With a 1 MHz resolution bandwidth, harmonics that lie close to the fundamental, especially on the lowest bands, can be hidden in the skirt of the fundamental, so this is not a sensitive measurement there.
The 10m plot is different: it shows a clear spur at roughly 8 MHz, at about -20 dBm on the analyzer, which is around 27 dB below the fundamental (read from the plot). There is also a small bump near twice the carrier frequency. I have not yet identified the source of the spur at 8 MHz, and none of the other bands shows anything comparable. It is the only spur on any band that stands out clearly.
160m
80m
60m
40m
30m
20m
17m
15m
12m
10m
6m
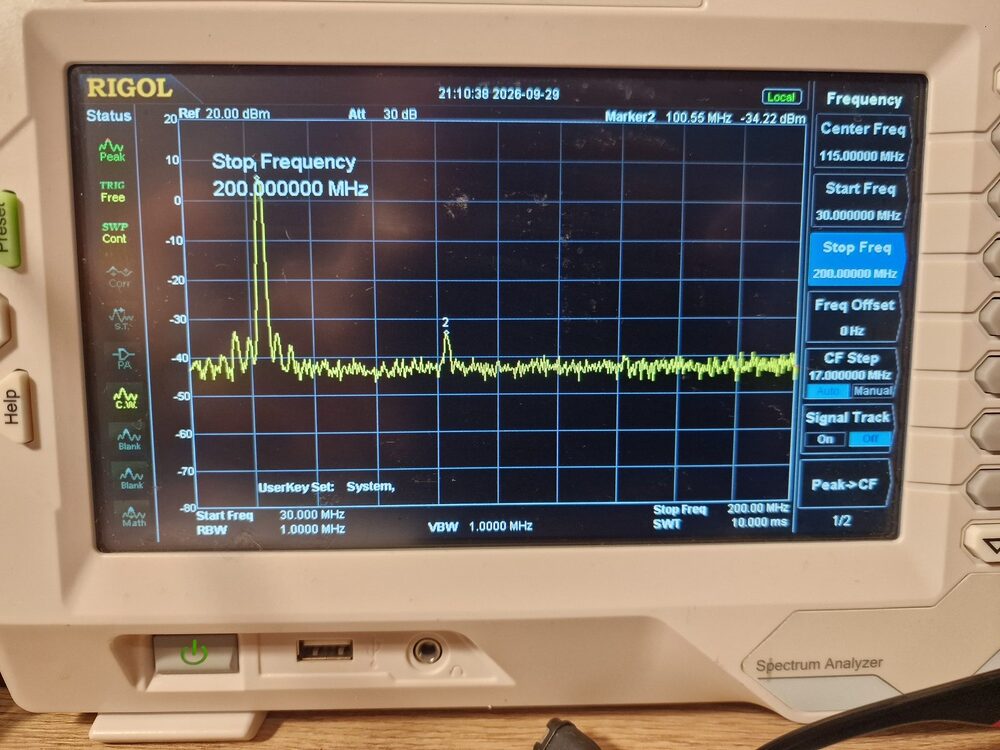
Output spectrum of the QMX+ on 6m, measured with a Rigol DSA815 (span 30-200 MHz, RBW and VBW 1 MHz). The QMX+ was connected to a dummy load, with a 30 dB attenuator in front of the analyzer input. The fundamental is on the left, at about 50 MHz.
The only spur visible above the noise floor is the second harmonic at 100.55 MHz (marker 2, -34.2 dBm), about 40 dB below the fundamental (+5.6 dBm on the analyzer). The third harmonic, at about 150 MHz, is not visible above the noise floor, and nothing else stands out up to 200 MHz, including around 135 MHz, where the low-pass filter sweep shows a peak. There are some small bumps close to the fundamental.
With the 30 dB attenuator, +5.6 dBm at the analyzer corresponds to roughly 35.6 dBm, or about 3.6 W. This is with the PA voltage at its maximum in the menu and a 12.6 V supply. So on 6m I can't reach 5 W. The same goes for 17m, 12m and 10m, as the table below shows.
Output power at maximum PA voltage
Power is the marker level on the analyzer plus the 30 dB attenuator, converted to watts. The tolerance of the attenuator is not included.
| Band | Analyzer (dBm) | At the radio (dBm) | Power (W) |
|---|---|---|---|
| 160m | 9.64 | 39.64 | 9.2 |
| 80m | 8.72 | 38.72 | 7.4 |
| 60m | 7.77 | 37.77 | 6.0 |
| 40m | 7.34 | 37.34 | 5.4 |
| 30m | 8.27 | 38.27 | 6.7 |
| 20m | 7.22 | 37.22 | 5.3 |
| 17m | 6.91 | 36.91 | 4.9 |
| 15m | 8.29 | 38.29 | 6.7 |
| 12m | 5.74 | 35.74 | 3.7 |
| 10m | 6.74 | 36.74 | 4.7 |
| 6m | 5.62 | 35.62 | 3.6 |
In normal use I set the PA voltage to 9.6 V in the menu, which gives 5 W on most bands. On 6m I can't reach 5 W, even at the maximum PA voltage.
Still to add
- Follow-up on the spur on 10m near 8 MHz (exact frequency and level)
Comments